library(ade4)
data("ecg") #ts object
#Time Series:
#Start = 0.31
#End = 11.6822222222222
#Frequency = 180
head(ecg)
[1] -0.104773 -0.093136 -0.081500 -0.116409 -0.081500 -0.116409The ECG records the electrical signal from the heart. In a clinical record it is performed as a 12 lead recording. The ECG contains an initial P wave which originates from the atrium. The P wave is absent in patients with atrial fibrillation. The RR interval is used to measure the heart rate. A false assumption is that the heart rate is constant but measurement shows beat to beat variation. Heart rate variability is a feature of health.
The ecg dataset of one patient contains 2048 observations collected at a rate of 180 samples per second.
library(ade4)
data("ecg") #ts object
#Time Series:
#Start = 0.31
#End = 11.6822222222222
#Frequency = 180
head(ecg)[1] -0.104773 -0.093136 -0.081500 -0.116409 -0.081500 -0.116409plot(ecg)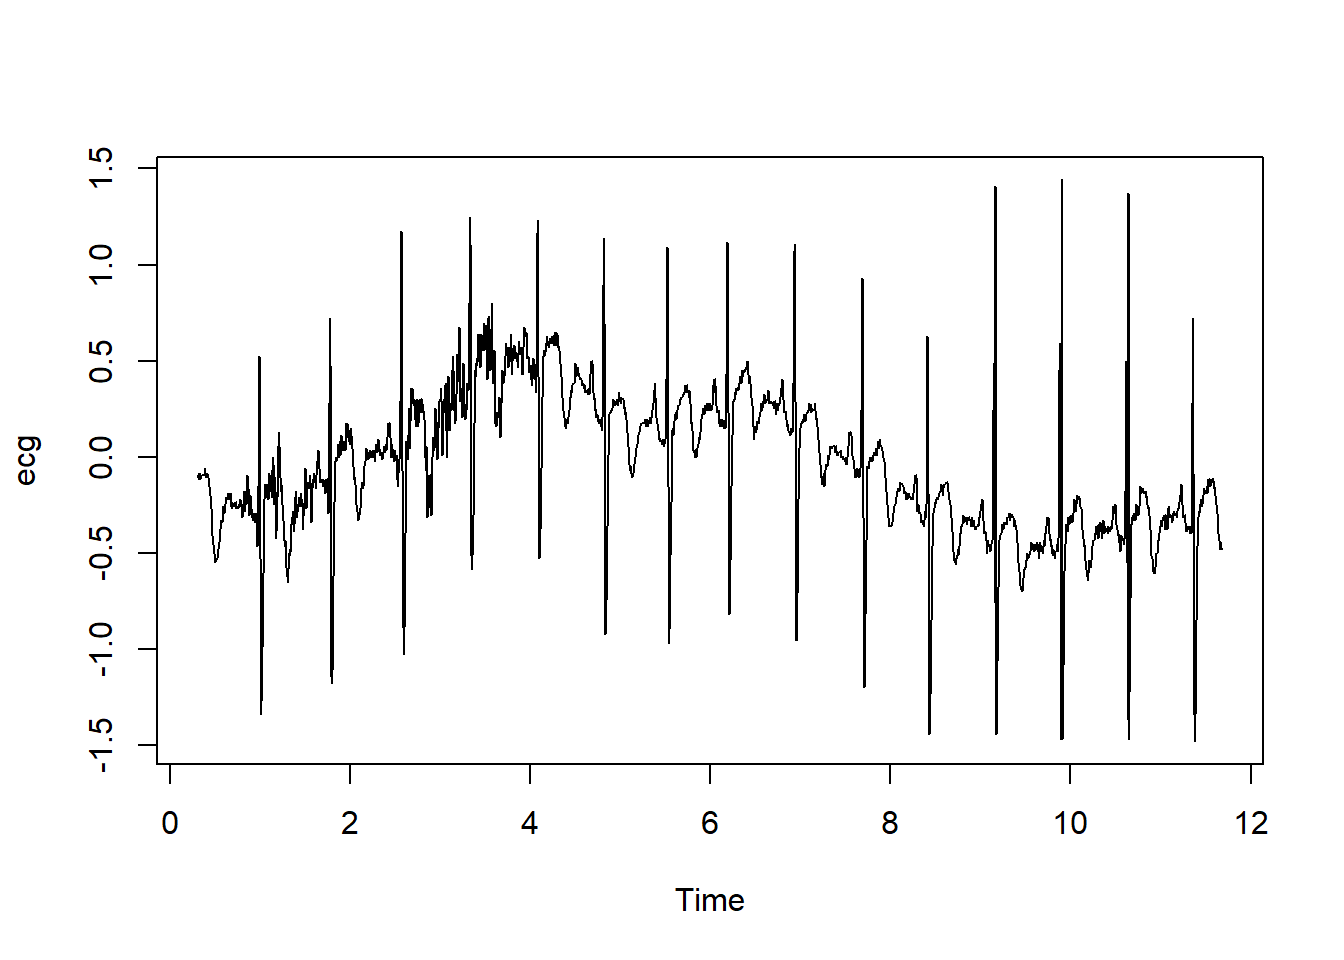
Let’s look now at the Hart dataset.
ECG<-read.csv("../../DataMining/python_journey/Heart/ECG/data.csv")

#ECG is a dataframe object

plot(as.ts(ECG)) # from base R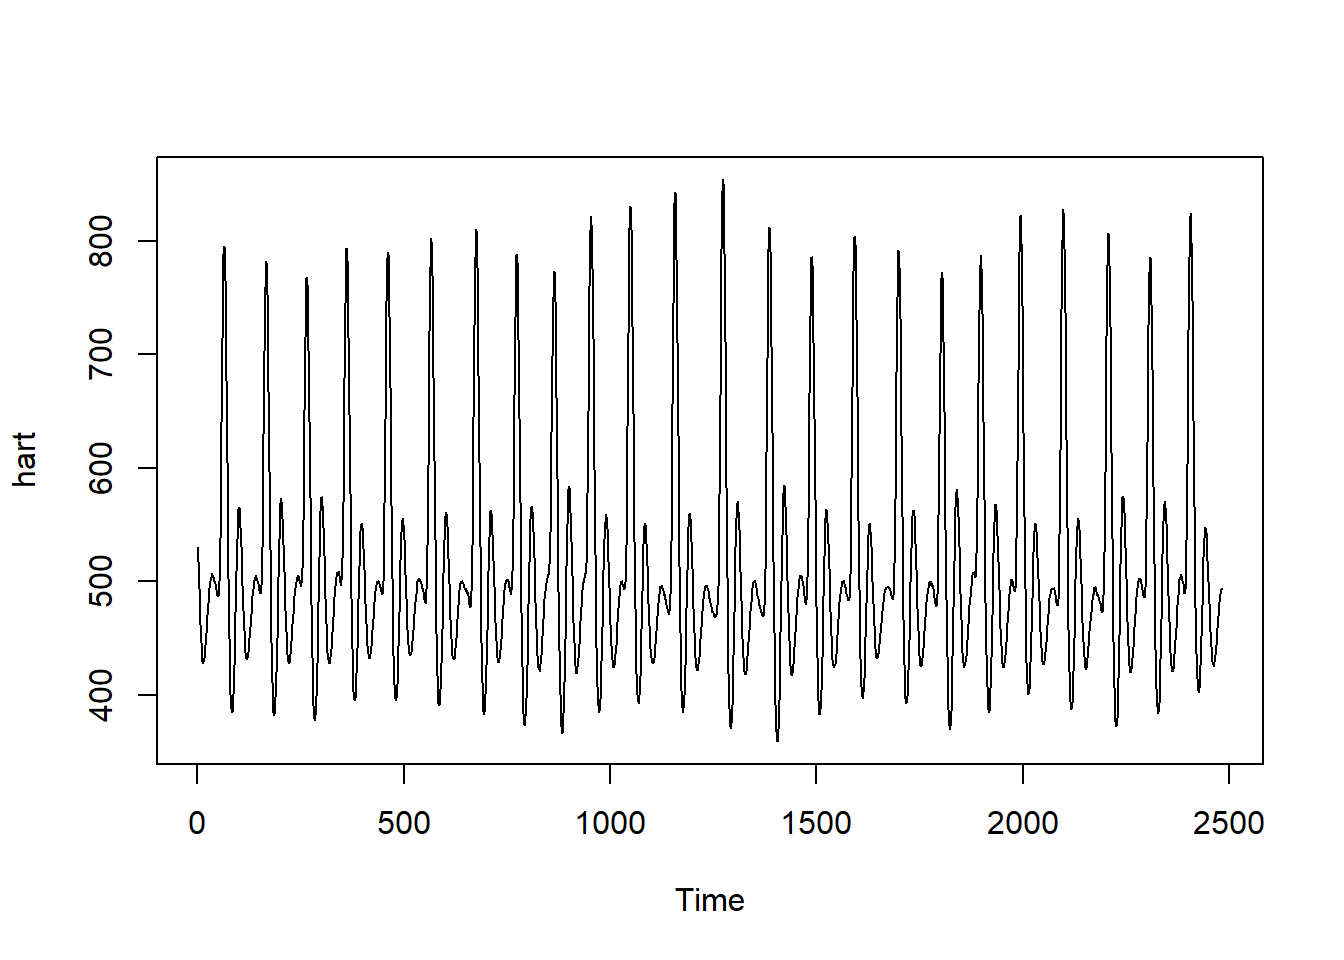
create a ts object by providing starting and end time and frequency. the plot of the data now has a new x limit.
ECG1<-ts(ECG$hart, start=c(0.31,13.7), frequency=180)

plot(ECG1)
EEGECG<-read.csv("../../DataMining/python_journey/Heart/ECG/eeg_stroke_ecg.csv")

#this data has 2 columns time and ECG

plot(as.ts(EEGECG$ECG))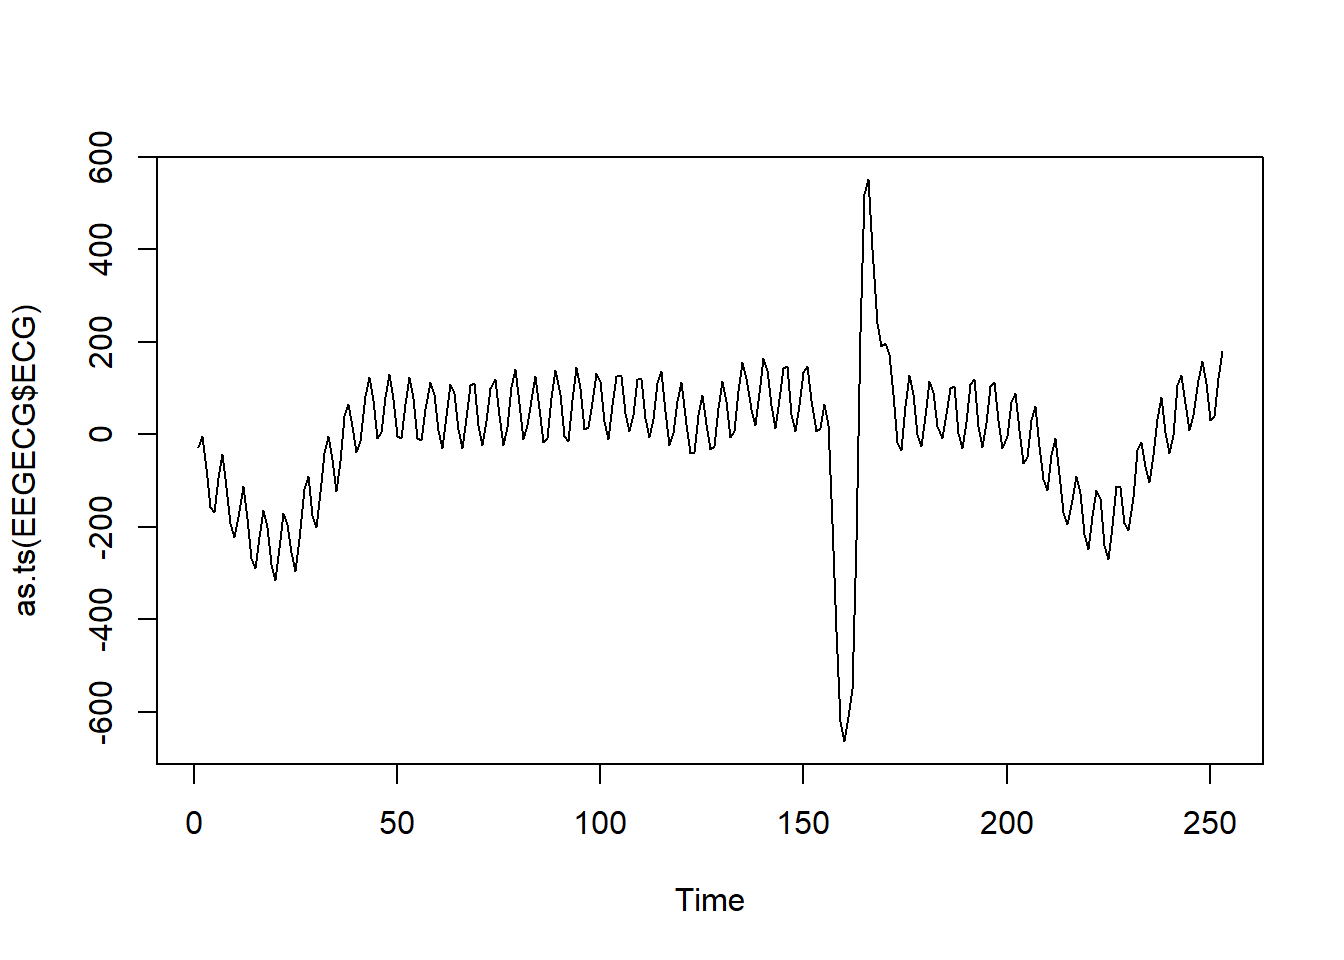
ECG2<-ts(EEGECG$ECG, start=c(0.31,6.75), frequency=60)
plot(ECG2)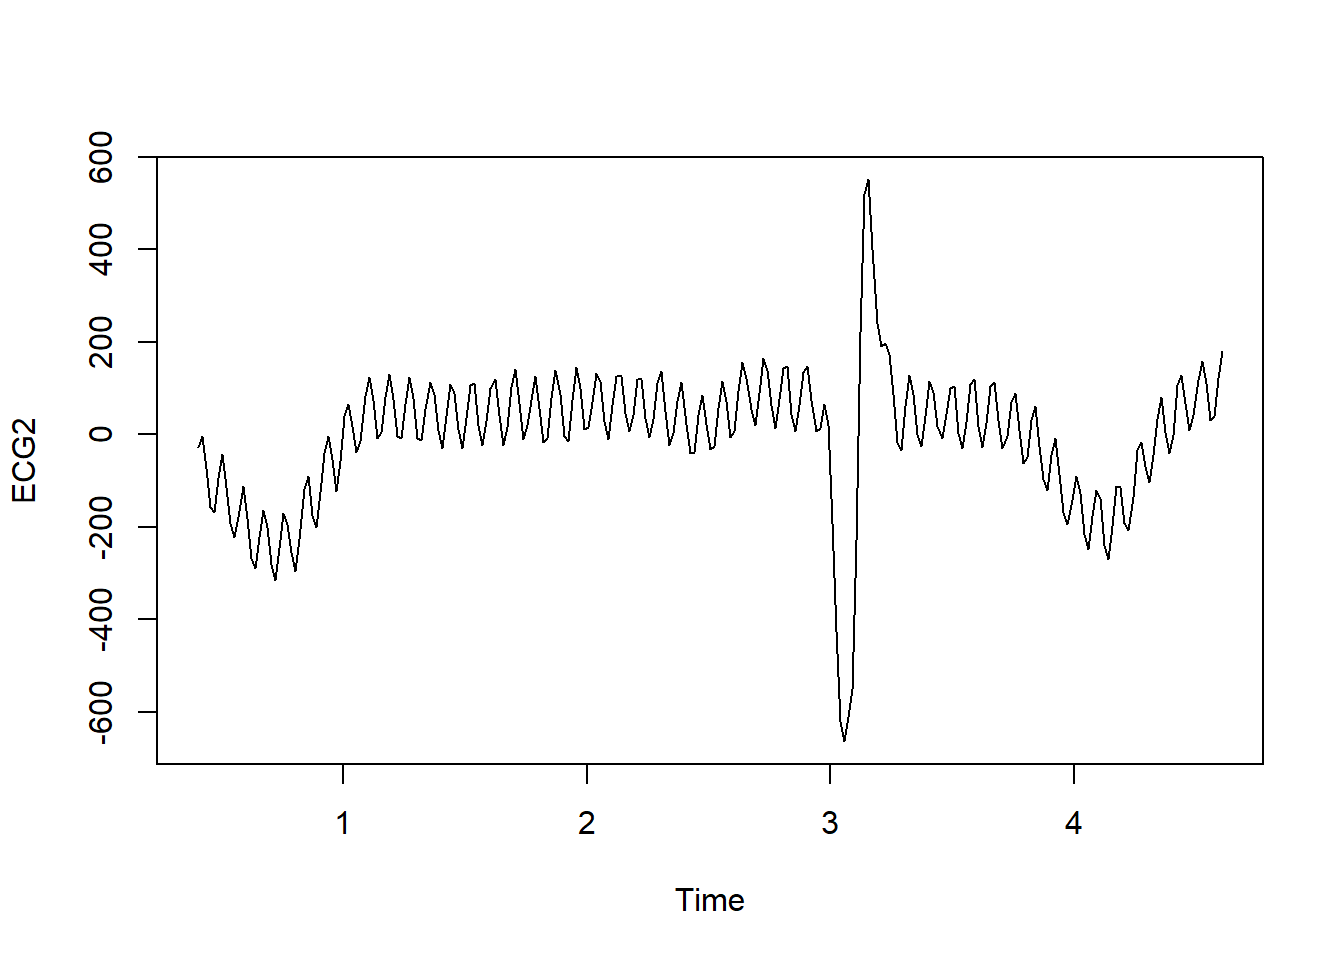
Data from Samsung smart watch series 5, acquired for 30 seconds at 500 Hz
library(tidyverse)── Attaching core tidyverse packages ──────────────────────── tidyverse 2.0.0 ──
✔ dplyr 1.1.2 ✔ readr 2.1.4
✔ forcats 1.0.0 ✔ stringr 1.5.0
✔ ggplot2 3.5.1 ✔ tibble 3.2.1
✔ lubridate 1.9.2 ✔ tidyr 1.3.0
✔ purrr 1.0.1
── Conflicts ────────────────────────────────────────── tidyverse_conflicts() ──
✖ dplyr::filter() masks stats::filter()
✖ dplyr::lag() masks stats::lag()
ℹ Use the conflicted package (<http://conflicted.r-lib.org/>) to force all conflicts to become errorsecg<-read.csv("./Ext-Data/20240226094349.csv")
ecg1<-ts(ecg$Lead, frequency = 500)
plot(ecg1)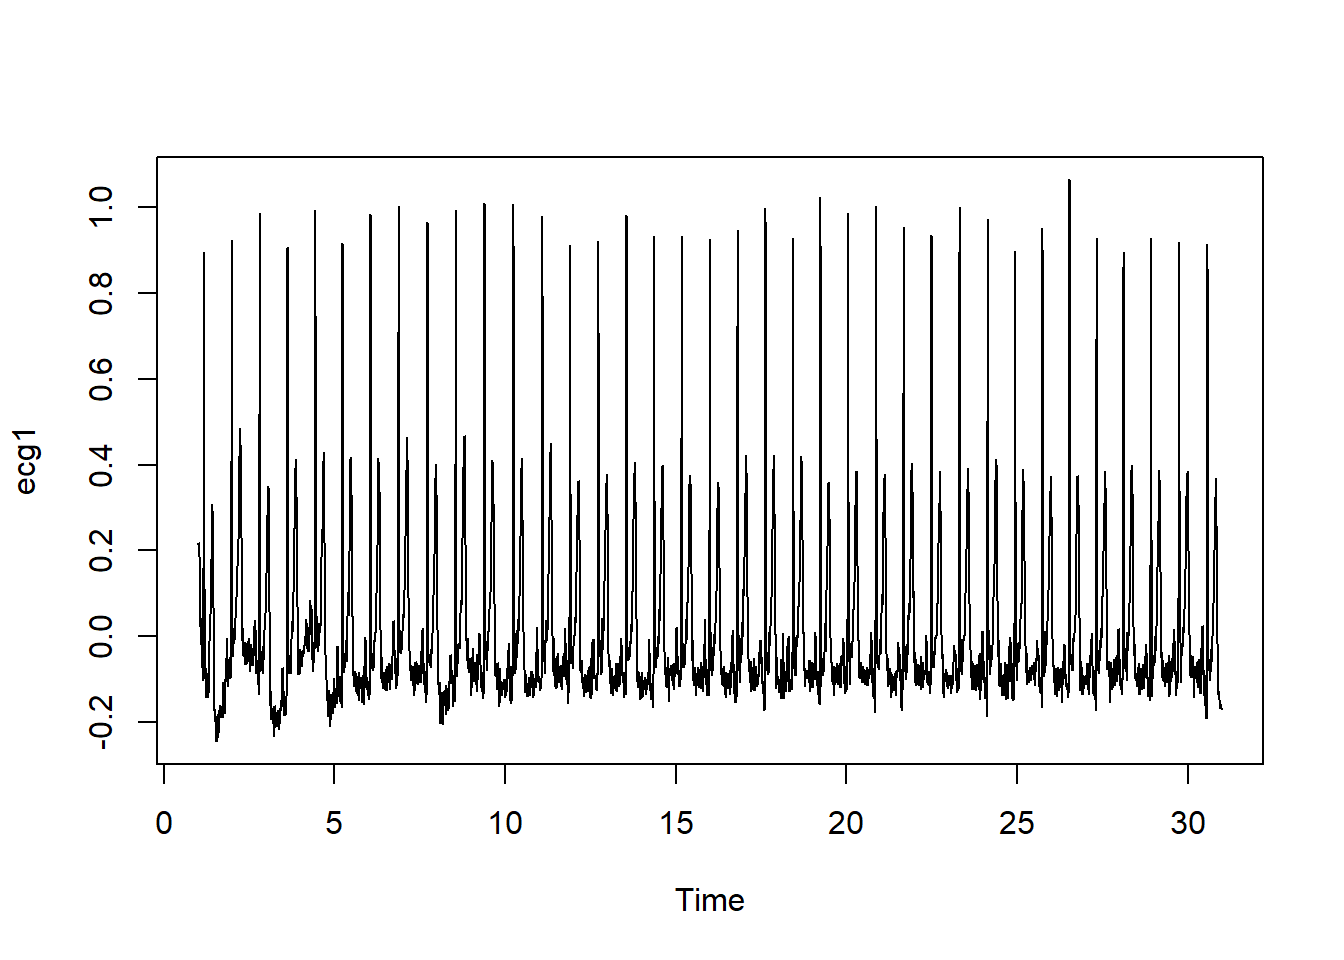
Here we illustrate the use of RHRV package to analyse ECG signal (Rodriguez-Linares et al. 2017). The code is provided on the RHRV website https://rhrv.r-forge.r-project.org/documentation.html. The example.beats data was download from this website and stored in the Data-Use folder. Here we make changes regarding the path of the data.
library(RHRV)Loading required package: waveslim
waveslim: Wavelet Method for 1/2/3D Signals (version = 1.8.4)
Attaching package: 'waveslim'The following object is masked from 'package:lubridate':
pmLoading required package: nonlinearTseriesRegistered S3 method overwritten by 'quantmod':
method from
as.zoo.data.frame zoo
Attaching package: 'nonlinearTseries'The following object is masked from 'package:grDevices':
contourLinesLoading required package: lombhrv.data = CreateHRVData()
hrv.data = SetVerbose(hrv.data, TRUE)
#setwd("C:/RHRV")
hrv.data = LoadBeatAscii(hrv.data, "example.beats.txt",
RecordPath = "./Data-Use/" ) Loading beats positions for record: example.beats.txt Path: ./Data-Use/ Scale: 1 Date: 01 / 01 / 1900
Time: 00 : 00 : 00 Number of beats: 17360 plot(hrv.data$Beat$Time)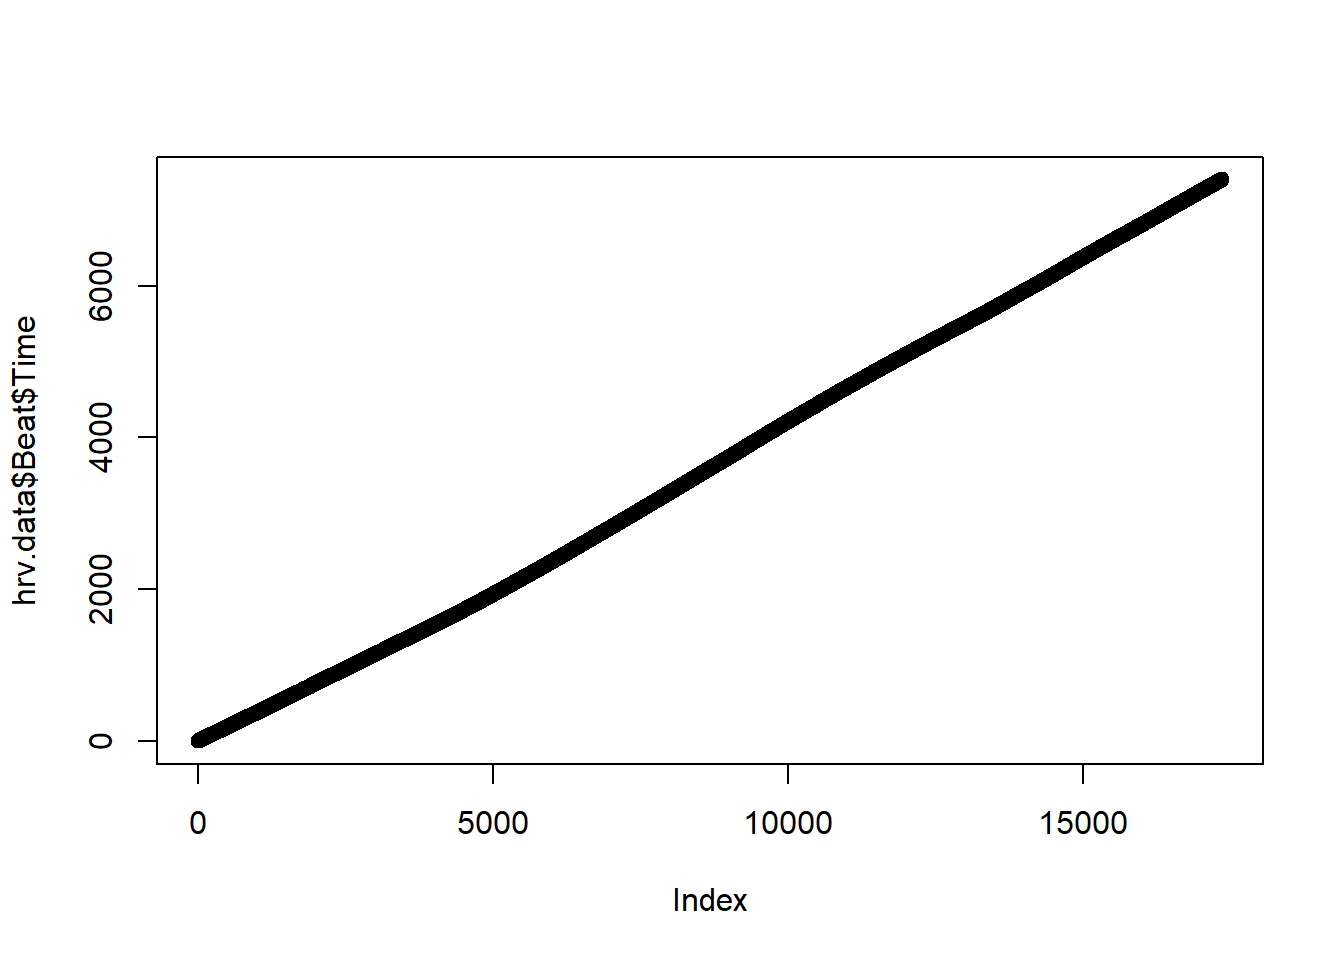
hrv.data = BuildNIHR(hrv.data) Calculating non-interpolated heart rate
Number of beats: 17360 PlotNIHR(hrv.data) Plotting non-interpolated instantaneous heart rate Number of points: 17360 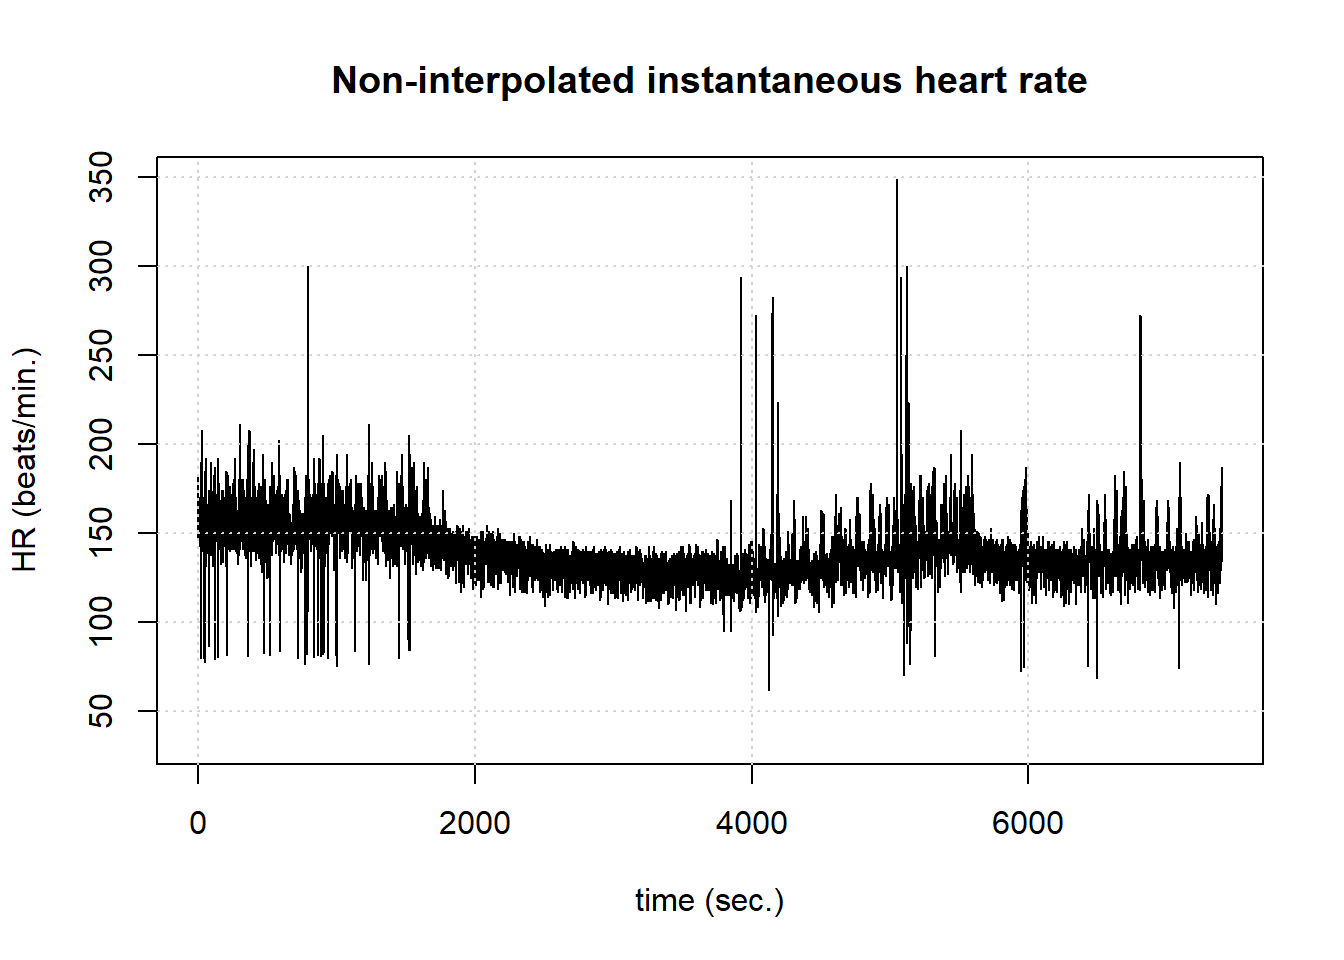
hrv.data = FilterNIHR(hrv.data) Filtering non-interpolated Heart Rate Number of original beats: 17360 Number of accepted beats: 17248 PlotNIHR(hrv.data) Plotting non-interpolated instantaneous heart rate Number of points: 17248 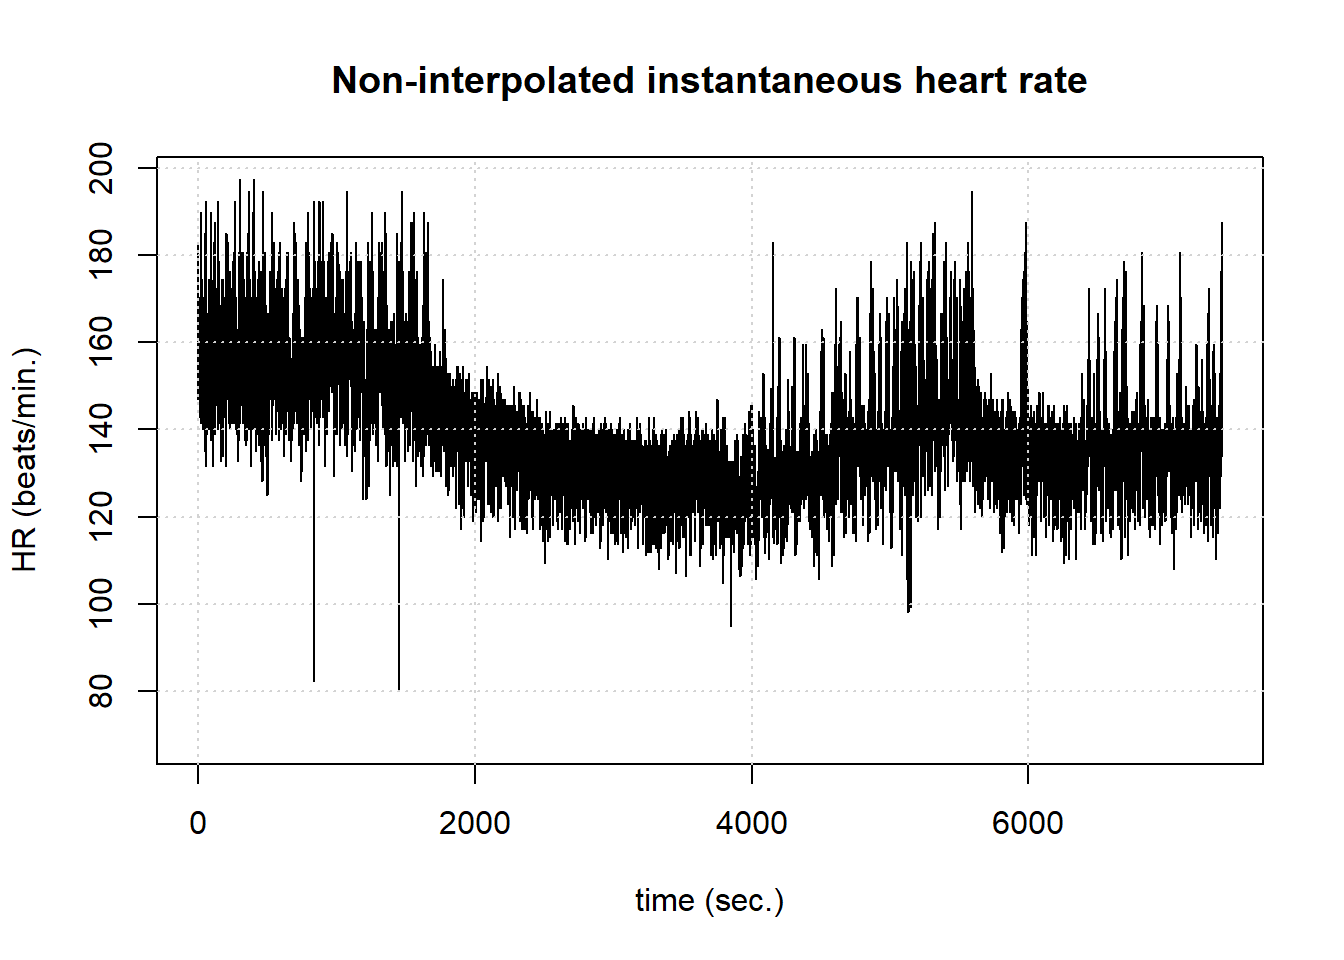
The eegUtils package has useful methods for plotting EEG. https://craddm.github.io/eegUtils/index.html. According to the site, it has functions for importing data from Biosemi, Brain Vision Analyzer, and EEGLAB.
#devtools::install_github("mne-tools/mne-r")
#remotes::install_github("craddm/eegUtils@develop")
library(eegUtils)
Attaching package: 'eegUtils'The following object is masked from 'package:stats':
filterplot_butterfly(demo_epochs)Creating epochs based on combinations of variables: epoch_label participant_id 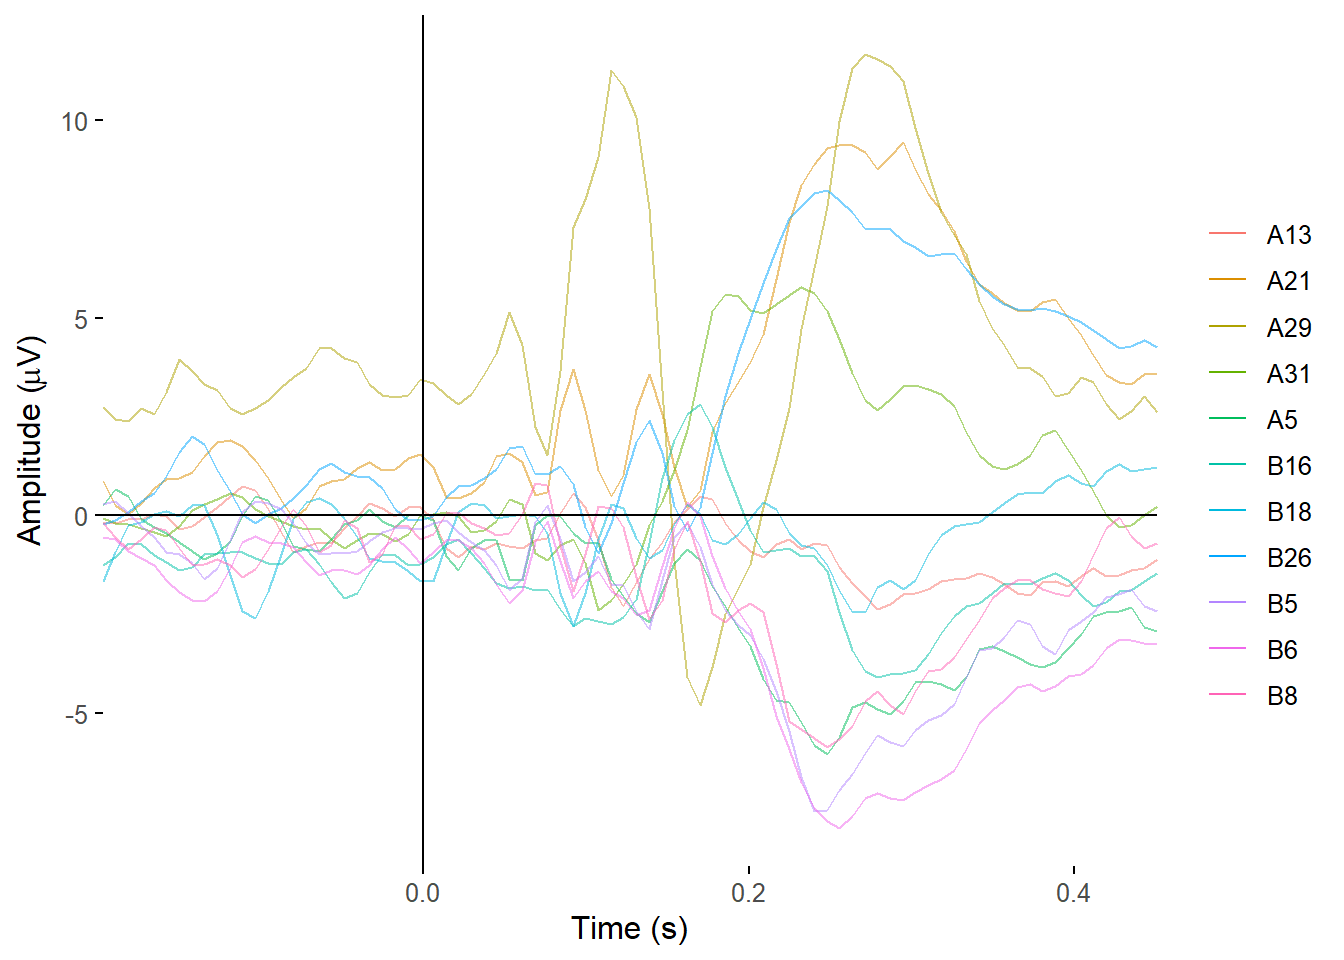
topoplot(demo_epochs,
         time_lim = c(.22, .25 ))
Creating epochs based on combinations of variables: epoch_label participant_id Using electrode locations from data.Plotting head r 95 mm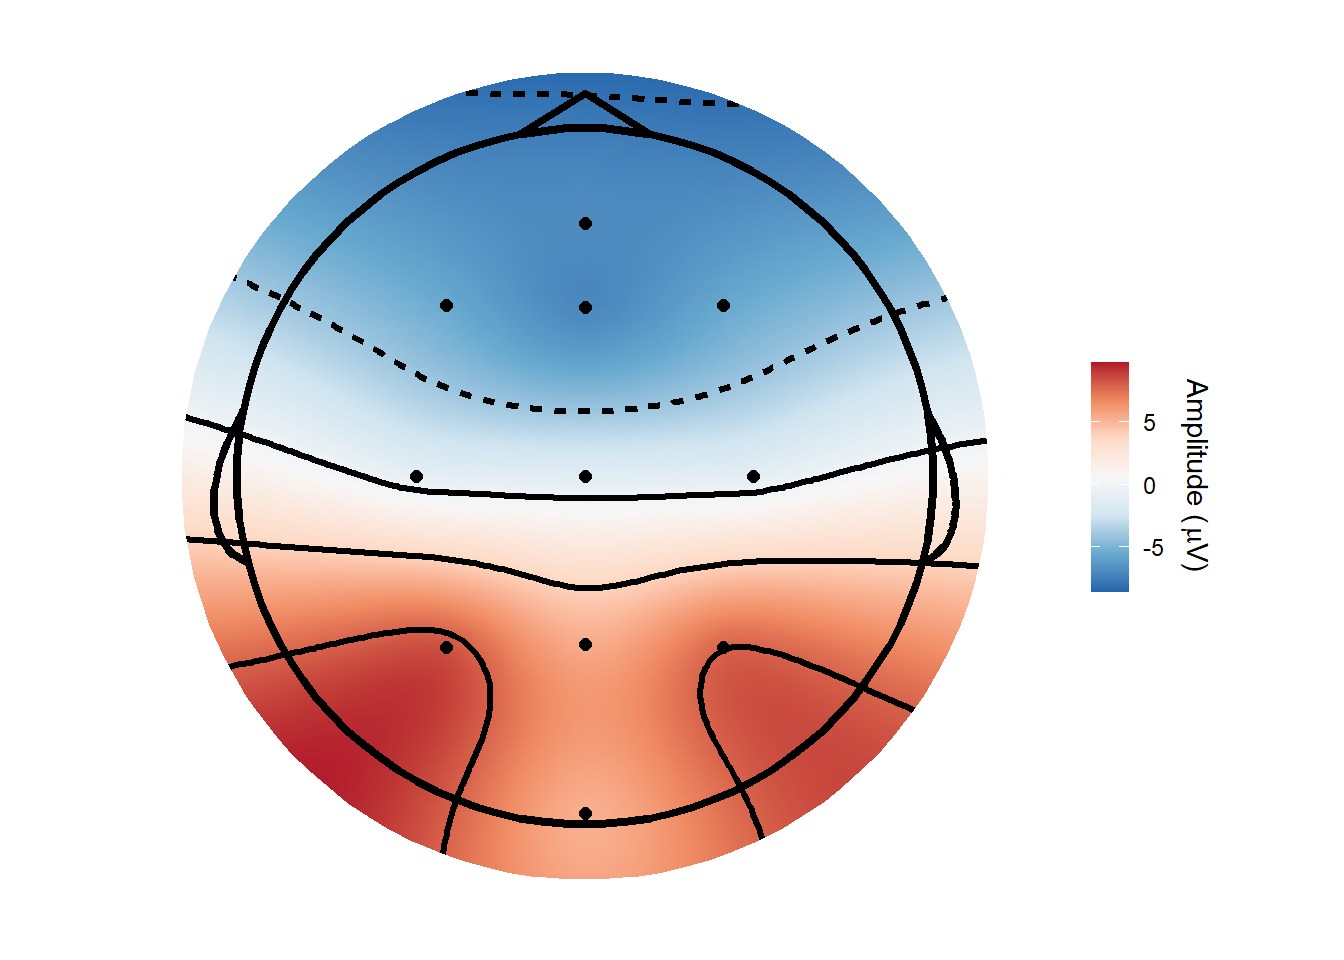
The following data is from https://datashare.ed.ac.uk/handle/10283/2189
library(eegUtils)
library(R.matlab)
limo_test <- import_set("limo_dataset_S1.set")
limo_cont <- R.matlab::readMat("continuous_variable.mat")
limo_cat <- readr::read_csv("categorical_variable.txt",
                            col_names = c("cond_lab"))
The MNE-R package is an interface to MNE package in Python. It is an excellent package for signal processing.