5  Python

Python can be run directly from R markdown file. It requires that python be specified instead of R. The use of python here requires that Miniconda or Anaconda be installed. Installation of Miniconda via reticulate package will be shown below.

import pandas as pd
import matplotlib.pyplot as plt
import numpy as np

#dataset containing locations of ms clinics in Victoria
dataset = pd.read_csv('./Data-Use/msclinic.csv') #Read data from CSV datafile
dat=pd.DataFrame(dataset)
#print 10 rows
print(dat.head(10))
          id  public  clinic  ...        lat         lon  metropolitan
0        mmc       1       1  ... -37.920668  145.123387             1
1        rmh       1       1  ... -37.778945  144.946894             1
2        aus       1       1  ... -37.756412  145.060279             1
3        alf       1       1  ... -37.845960  144.981852             1
4      stvin       1       1  ... -37.807586  144.975029             1
5        bhh       1       1  ... -37.813525  145.118510             1
6  frankston       1       1  ... -38.151211  145.129160             1
7    geelong       1       1  ... -38.152047  144.364647             0
8   sunshine       1       1  ... -37.760219  144.815301             1
9   northern       1       0  ... -37.652886  145.014486             1

[10 rows x 10 columns]
exit
Use exit() or Ctrl-Z plus Return to exit

Passing Python object to R and py$ in front of Python object in R.

head(py$dat)

Let’s open the the Hart dataset in R and pass it to Python.

ECG<-read.csv("../../DataMining/python_journey/Heart/ECG/data.csv")

#ECG is a dataframe object

plot(as.ts(ECG)) # from base R

To pass a R object to python then add r. in front of object.

#The ECG data is now passed as r.ECG
print(r.ECG)
      hart
0      530
1      518
2      506
3      494
4      483
...    ...
2478   489
2479   491
2480   492
2481   493
2482   494

[2483 rows x 1 columns]

The data can now be plotted using matplotlib library from Python.
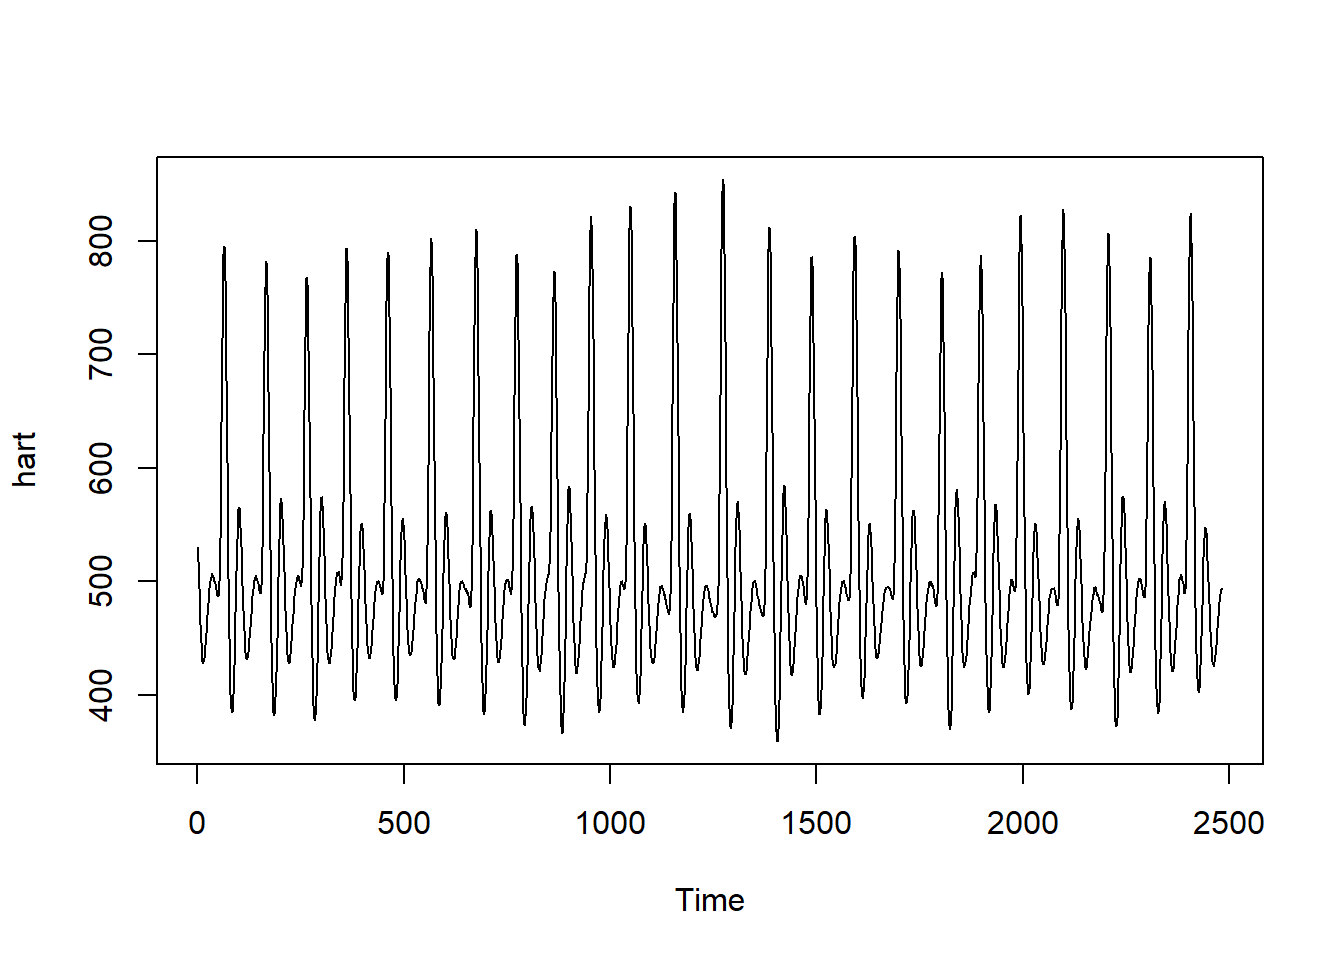
import pandas as pd
import matplotlib.pyplot as plt
import numpy as np
import math

#Matplotlib
plt.title("Heart Rate Signal") #The title of our plot

#ECG is data frame and hart is the column
plt.plot(r.ECG.hart) #Draw the plot object

#Display the plot
plt.show() 
exit

5.0.1 Reticulate

Information on the use of Python in R is available at https://rstudio.github.io/reticulate/. The package reticulate can import Python function to work directly in R. Note that the chunk code heading here is r.

library(reticulate)
os <- import("os") #os is operating system package
os$listdir(".")
 [1] ".quarto"                         ".Rhistory"                      
 [3] ".Rproj.user"                     "appendix.qmd"                   
 [5] "bayesian-analysis.qmd"           "bayesian-analysis_files"        
 [7] "bipartiteD3Script.css"           "bipartiteD3Script.js"           
 [9] "colin_1mm.hdr"                   "colin_1mm.img"                  
[11] "colin_1mm.mat"                   "cover.png"                      
[13] "Data-Use"                        "data-wrangling-images.html"     
[15] "data-wrangling-images.qmd"       "data-wrangling-images_files"    
[17] "data-wrangling-python.qmd"       "data-wrangling-python.rmarkdown"
[19] "data-wrangling-python_files"     "data-wrangling-signal.html"     
[21] "data-wrangling-signal.qmd"       "data-wrangling-signal_files"    
[23] "data-wrangling.html"             "data-wrangling.qmd"             
[25] "data-wrangling_files"            "DKnut2.graph"                   
[27] "EMR_Stroke_ngs_records.Rda"      "EMR_Textmiing_ngs_records.Rda"  
[29] "Ext-Data"                        "Fagan_SpotSign.png"             
[31] "geospatial-analysis.qmd"         "geospatial-analysis_files"      
[33] "graph-theory.qmd"                "graph-theory_files"             
[35] "Healthcare-R-Book.Rproj"         "index.aux"                      
[37] "index.html"                      "index.log"                      
[39] "index.qmd"                       "index.tex"                      
[41] "index.toc"                       "intro.html"                     
[43] "intro.qmd"                       "intro_files"                    
[45] "lm.stan"                         "Logistic_GeneticAlgorithm.Rda"  
[47] "Logistic_SimulatedAnnealing.Rda" "machine-learning.qmd"           
[49] "machine-learning_files"          "metaanalysis.qmd"               
[51] "multivariate.qmd"                "multivariate_files"             
[53] "natural-language-processing.qmd" "operational-research.qmd"       
[55] "operational-research_files"      "references.bib"                 
[57] "references.qmd"                  "SEHospitals.png"                
[59] "site_libs"                       "statistics.qmd"                 
[61] "statistics_files"                "tabnet_heatmap.jpg"             
[63] "tabnet_learningrate.jpg"         "total_journal.Rda"              
[65] "vizjs.js"                        "_book"                          
[67] "_quarto.yml"                    

Here we provide another example on how to use Python in R. Note the change in the way we extract the stats module from scipy Python package.

data("mtcars") #mtcars data in R

library(reticulate)
np<-import("numpy")
pd<-import("pandas")

#equivalent in Python is from scipy import stats
sc<-import("scipy")
sc$stats$linregress(mtcars$mpg,mtcars$cyl)
LinregressResult(slope=-0.2525149506667544, intercept=11.260683180739264, rvalue=-0.8521619594266132, pvalue=6.112687142580981e-10, stderr=0.02830980675303087, intercept_stderr=0.5930361857152716)

5.0.2 Minconda

Miniconda and Anaconda can be installed directly from its website. Here we will illustrate installation of Miniconda from Rstudio. The install_miniconda function from reticulate library download Miniconda from the web.

#library(reticulate)

#this function is turned off as it only needs to be done once
#install_miniconda(path = miniconda_path(), update = TRUE, force = FALSE)

To find the libraries install in Miniconda

conda_list ()

5.0.3 Python environment

Unless specified, the default environment is r-reticulate. Setting the Python environment is important to avoid package incompatibility. To set the environment

library(reticulate)

#create virtual environment SignalProcessing
#virtualenv_create("SignalProcessing")

#activate virtual environment
#source SignalProcessing/bin/activate

#check version of python
#reticulate::py_config()

Some Python libraries such as pycox can be installed in R using install_py… this way.

library(reticulate)
#library(survivalmodels)
#install pycox for survivalmodels
#install_pycox(pip = TRUE, install_torch = TRUE)
#install_keras(pip = TRUE, install_tensorflow = TRUE)

#install other Python packages
#this is similar to pip install torch
#install_torch(method = "auto", conda = "auto", pip = TRUE)